Wednesday, April 27, 2011

Severe Weather

We here in the Pacific Northwest are moaning and groaning about below average temperatures and wet weather. Meanwhile, the Midwest, Southeast and Ohio Valley are being pounded with round after round of severe weather. It is just one wave after another of tornadoes, hail and damaging winds for these states. By the way, many of these states endured record snowfall totals during this past winter. Breaks in the weather have come at days at a time, but no real relief has been offered since the beginning of April. The numbers from the Storm Prediction Center really tell it all.

Here are preliminary tornado reports over the last 5 days. Keep in mind these are preliminary, and will take a while to officially be confirmed:Tuesday, April 26: 54 tornado reports Monday, 25: 44- one tornado may receive a EF-5 rating in Arkansas. Sunday, 24: 13 Saturday, 23: 9 Friday, 22: 28
That is an ugly stretch of storms. They were spread out across all of the Midwest and South. But that stretch of 5 days does not compare to reports a few days earlier. On April 19th, the SPC had
77 reports of tornadoes mainly in Missouri, Indiana, Illinois and Ohio. That was the third-highest total for the month so far. A few days earlier on the 16th, 139 unconfirmed tornado reports across North Carolina and Virginia. And the most reports of tornadoes for April came on the 15th when 146 reports came in from Mississippi and Alabama. In all, 654 reports have been made for the month of April, according to the Storm Prediction Center. Again, they are preliminary and it is possible that not all will be confirmed as tornadoes.Take a look at this map that shows the distribution of tornadoes so far this year (notice one in Oregon! It received an EF-0 rating). Often times, severe wind damage can be confused as tornado damage. It is the job of the NWS to analyze storm damage in person. This process is what gives us tornado ratings. Often people think that the Enhanced Fujita ranking system is based upon wind speeds when it actually is based upon damage.
How does this April's reports compare Aprils' past? In 2009, 226 tornadoes were confirmed. The 3 year average for April is 185 tornadoes. So, should all 654 reports be confirmed, that would be more than twice the 3-year average for the month of April! Incredible.
What's even more incredible is that the peak tornado season hasn't even started yet! That
distinction belongs to May with a 3-year average of 322 tornado reports. May also holds the all-time record for tornado reports of 543 in 2003.
What is the possibility of all 654 April reports this year being confirmed? Given the large number of reports, it would be hard to imagine that all of them were tornadoes. But all we have to do is look at January 2011 for evidence to the contrary. There were 10 preliminary reports of tornadoes this January. The actual report of tornadoes by NOAA was 16 (that also stands as the total number of official tornadoes so far this year, but February doesn't have official totals yet). So it is possible that these reports will be confirmed.
Along with severe weather comes loss of life. Over the decades of weather reporting and forecasting, deaths resulting from severe weather has improved greatly. More information at the fingertips of forecasters means improved warning systems. But the shear amount of storms this Spring season is starting to take its toll. April 2011 has 43 confirmed deaths from tornadoes. The 3-year average is only 6.
So WHY is all this happening? Let's take a look at the charts and find some similarities between April 15, 16, and 19.
Here are the charts for the 15th around 5 a.m.
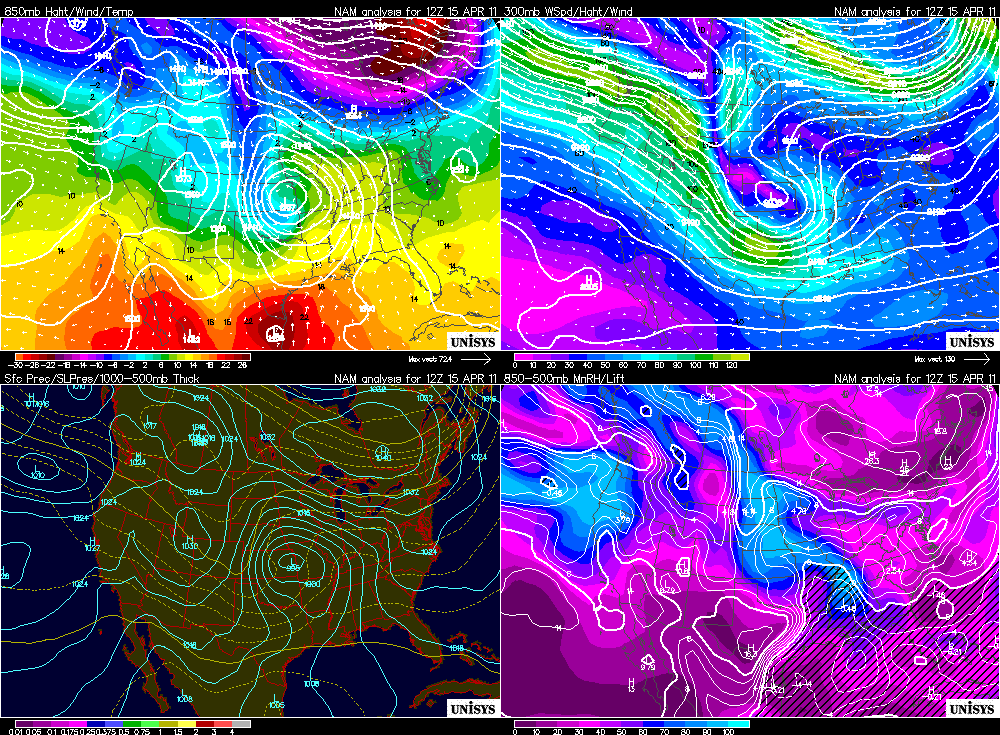
The maps we want to analyze are the two upper maps. The one on the left is the 850mb map. Look towards the Gulf Coast. Notice how warm, moist air is pouring in off the gulf into Louisiana and Mississippi indicated by the warmer colors. That causes instability and uplift in the atmosphere. The map to the right is the 300mb map. This shows the position of the jet stream. A strong, westerly stream is preferred for severe weather. That is exactly what we have. Lots of warm air, plus strong westerly jet is a great recipe for storms. Watch this as it moves east on the 16th. Here is the setup for April 16th around 5 a.m.

Now all the action has swung to the east. Cold stable air is now pouring into Louisiana and Mississippi a day after the severe storms and the warm moist air is now being forced up the eastern Atlantic. This was an interesting situation where the warm Gulf moisture was being sucked up and mixed in with the warm Atlantic moisture off the east coast. The warm air, plus a strong jet stream on the 300mb map that is evident over the Carolinas spawned a tornado outbreak of record proportions in North Carolina. It definitely helped that the storms really were initiated the day before over the south and continued as they migrated towards the east. But another thing that aided these storms the Appalachian Mountains. As air descends down the mountains, it is forced to stretch. Imagine an ice skater that is spinning. As the skater pulls their arms in, they spin faster and faster. This is conservation of momentum. That is what the air is doing as it travels down the back side of the Appalachians. The air is warming, compressing and spins a bit faster in order to conserve energy. A perfect setup for tornadoes. A few days later, it was the Ohio Valley's turn.
Here is the setup for April 19th
Overall, this setup isn't much different than the initial outbreak on the 15th. There is a tighter low over the central part of the country again that is pulling the warm air from the south. The broad cool air stretches east-west along Ohio, Indiana, Illinois. That is our target. A strong jet stream just to the north of those states helps enhance the storms. The main factor though is the tight gradient between the warm and cold air. In the lower left hand map, you see surface pressure plotted. The main feature is that low. The bulge in the isobars protruding eastward is the warm front. It shows up nicely on the 850mb map as well, huh? This system resulted in those 77 tornado reports!
So knowing that April could set a record for confirmed tornadoes, what does that mean for May when historically we see the most tornadoes? We don't know. The broad scale weather pattern is always changing. We can only see 3-5 days out in regards to issuing credible severe weather threats. So in that sense, there is no use in forecasting out any further. In my eyes, it is smart to only look ahead one day at a time. As of today, looking ahead shows a slight break for tomorrow. A break which will be much needed for many as clean up efforts have been hampered by more storms. The actual number of tornadoes will take a while to be confirmed but given what is going on, take solace in the rain and mid-50's.

****UPDATE****
Yesterday's storms that ripped through the South added to what will no doubt become a historic and infamous April. Various reports have the death toll reaching 194 as of 6 a.m. this morning. No doubt that number will rise as the clean up effort begins in earnest this morning. I would assume that there would be potential for an EF-4 or even EF-5 rating out of this outbreak given the reports and videos.
There have been 162 reports of tornadoes from yesterday, making it the most so far this year. As I mentioned yesterday, most likely not all will be confirmed as tornadoes and some reports may even be of the same tornado. While watching coverage yesterday, news stations in Birmingham, Alabama caught a twister that may have been on the ground for 45 minuets! It is tough to put this event into words, so I'll let the pictures do the talking.

Tornado caught in Tuscaloosa, Alabama- one of the hardest hit areas- via Crimson Tide Productions:

4-27-11 Tornado Tuscaloosa, Al from Crimson Tide Productions on Vimeo.


A days worth of action caught by the guys from TornadoVideosdotnet-


Photo snapped by a reporter for WBRC as people take shelter in Cullman, AL
http://twitpic.com/4q93rs

Another video from Tuscaloosa. Not sure who to give credit to, but it isn't me...


An image from Twitter of the damage from Tuscaloosa, completely demolished- via @danamlewis
http://www.twitpic.com/4qaxnn

This monster skirts just past Bryant-Denny Stadium, home of the Crimson Tide-via Clay Hasenfuss

Tuscaloosa Tornado (4/26/2011) by sportsxbrooks


Wednesday, April 13, 2011

Spring vs Winter

The battle rages on around most of the country. This is the time of year where complaints start to roll in. Too much rain in Oregon. Too much heat in the Southwest. Too much snow in the Northeast! I have been hearing plenty of them and I am sure you have them too! Here in the Northwest, March left us with plenty of wet weather and April hasn't been too stellar either. Take a look at this map which was used on the Fox 12 Weather Blog (those guys do a really good job over there) that really sums up the wet Spring:


How about the Great Plains? They had a record-breaking winter and now spring and winter are REALLY going at it. The topography of the United States allows for a perfect set up for this battle. Cold air from Canada filters down the east side of the Rockies at the same time warm air pushes up the Midwest from the Gulf of Mexico. With no mountain chains to block either air mass, they clash and the result is awesome but very dangerous and deadly.


Essentially, warm air and cold air don't get along. The result causes instability in the atmosphere and can result in any number of severe weather events. Here is a look at the clashing of air masses on weather maps. These maps reflect a severe weather outbreak from last week that stretched from Minnesota to Michigan.

Note the map in the upper left-hand side. This is the temperature of the air at about 5,000 feet. Notice the warmer air pushing from the south to the north and the contrasting cold air moving down from the north. Check out this radar image from one of the storms that moved through Wisconsin.
The National Weather service receives reports of damage from these storms, anything from wind damage to tornado and hail damage. This is a map from the same event:
This sort of weather is my dream job! To forecast it. To capture it. To live it! I sit at work and do my best to forecast severe weather across the country each day. The spring is the best time for this across most of the United States. In fact, as I look at the maps today, the Midwest is in store for another round of potentially severe weather Thursday and Friday!

Look at the bulls-eye of low pressure showing up over Nebraska, Oklahoma, Missouri and Arkansas. Notice the warm air and cold air mixing? The black arrows indicate wind direction and speed. Lots of mixing of warm and cold air, so this is an area of concern for severe weather on Thursday and Friday. My thoughts are echoed by the Storm Prediction Center:

Great set-up for the next few days for severe thunderstorms and tornadoes! Gotta love this time of year.

Wednesday, March 30, 2011

Can The Midwest Get A Break!?

I have been sitting on this idea of talking about the wild winter weather most of the country has seen. It would seem that Oregon has been the only contiguous state that did not see any sort of significant winter weather. The Upper Midwest, Midwest, and East coast have been slammed several times with heavy snow starting in November and continuing even today! Today's forecast is calling for snow in parts of Nebraska and Pennsylvania. I looked into some numbers from some major cities around the central part of the country. Check out these seasonal average snow fall totals compared to the observed totals for this season:

Minneapolis/St. Paul, MN average: 42.3" observed: 76.5"
Chicago, IL average: 28.3" observed: 56.3"
Topeka, KS average: 4.3" observed: 19.1"
Oklahoma City, OK average: 2.1" observed: 18.9"
Sioux Falls, SD average: 7.4" observed: 14.8"

Some pretty impressive numbers! "Insert whitty Global Warming joke here" But seriously...that is a lot of snow. Which means that snow pack is probably a bit above normal for a lot of locations around the country. This could lead to water basins being at or above normal for many locations once melting begins. The people who have endured this extreme winter are probably looking forward to a break this Spring. However, Spring does not mean that there will be a break in the active weather.

We have just entered "tornado season", that typically extends from March through May-June. Spring is notorious for severe weather across much of the Midwest. The severe weather is caused by collision of the cool winter air still pouring down from Canada and warmer summer air that is pushing its way up from the south. These two air masses mix and create a ton of instability that often spins up severe thunderstorms and tornadoes. Many of the states listed above lie directly in what is coined "Tornado Alley". This is where the highest frequency of tornadoes occur in the world!


Of course, we know tornadoes can be very dangerous and damaging. But we also need to keep in mind how dangerous all the snow can be, especially when it all melts when temperatures turn warmer and coupled with heavy rains from intense storms, can result in flooding. So even though the calendar says Spring, it doesn't mean a break in the severe weather for those who endured a long Winter.

Friday, March 11, 2011

A Day To Remember!

Friday, March 11th, 2011. Probably a day I will never forget. I don't yet know anyone who was immediately impacted by the 8.9 magnitude earthquake that rocked Japan (using the term "rocked" doesn't even do it justice). But as I pulled into the parking lot at work Friday at 2:30 a.m., I realized that it probably wouldn't be hard to stay awake this Friday.

My station was all over the news from the time the earthquake was reported. The 10 o'clock news crew was STILL at work at 2:30 the following morning when I walked into the studio. For a crew not use to running 5 straight hours of coverage, I was more than impressed with their drive. I immediately had to begin taking in information. I had NO clue the amount of devastation that had occurred. It took about 20 minuets to get oriented and on the same page with the rest of the crew. Sometime after 3 a.m., our morning crew officially took over and thus began an epic day. We wound up being on-air until 1:13 p.m.! Our morning anchors Pete and Deb, and weather guy Andy went through roughly 10 hours of straight, commercial-free news coverage!

The people behind the scenes were just as important in getting the coverage out for that long. So many people go into keeping a show on air for that long. At the end of the day, I have to give huge kudos to all of my co-workers. They inspired me to be at the top of my game all day long and I could not ask for a better set of co-workers and friends at the station! These people are all pros and contributed to a day I will never forget! Thank you all!

Monday, January 31, 2011

Forecast Wrap-Up

My apologies about the absence of a final post on Saturday. A few factors played into it: I was not at work in order to create my graphics and I actually did not have any Internet at my house on Saturday. Excuses, excuses I know. I may be looking for excuses for my forecast on Sunday as well! Things really didn't pan out the way I thought. In my last post I had determined with some confidence that Sunday would start mostly cloudy and eventually the clouds would part in the afternoon, remaining dry all day. But that didn't happen. One reason (excuse?) why...the models seemed to delay the rain!

In the few days leading up to Sunday, rain was forecasted for late Friday night and into Saturday. That didn't happen! Saturday was mostly dry But what did happen was a mostly dry, mostly cloudy Sunday with some rain that moved in late afternoon/early evening. Models tend lag or even accelerate some times and that can throw a wrench into the process of forecasting. The only way to maneuver around that is to know how certain models handle certain weather systems. I haven't been looking at the models long enough to pick up on the their tendencies. That will come with time. So really my conditions forecast was not all that far off except that rain ruined the accuracy of the forecast. I will be one of my toughest critics and give myself an X on the conditions but only by 0.03" (recorded amount of rain at the Portland International Airport).

My final forecast had a temperature high of 48 degrees. My forecast low was 38. Now, in order to give myself full marks for an accurate temperature forecast, I'd like to be with in +/- 3 degrees of the actual observed temperature. Sunday saw a high of (drum roll, please)...50 degrees! That high temperature occurred sometime between 2-3PM, typical for this time of year when our sun angle is rather low. During the summer we get our warmest temperatures of the day between 4-5PM. So my high temperature forecast was a success, missed it by 2 degrees. For the low, Sunday got down to...39 degrees. Missed it by one degree! Not to shabby.

If you would have asked me which I had more confidence in, my conditions forecast or my temperature forecast, I would have gone with the conditions. At least I got something right! I hope that this process allowed you to look into how I do my job and all the moving parts associated with it. I know weather forecasters, ones on TV especially, get a bad wrap. We are forecasting for an environment that is always changing. Portland and the Pacific Northwest as a whole is challenging to forecast fore given that most of our storm systems come off the Pacific ocean where current observations just aren't as abundant as if we lived in Kansas City. The Pacific ocean is dotted with some weather buoys but those don't help us nearly as much as observations from other cities. Places all across the central and eastern U.S. get to see what is approaching them and how an air mass headed their direction has been impacting the cities to their west. Also, the amount of model information out there is large. Many models and charts are at the forecasters fingertips and it can be a challenge to select which one is the correct one. All this information must be taken into account. It is definitely a challenge but someone has got to do it. I am glad I can!

Friday, January 28, 2011

Day 5

Alright, we are closing in on Sunday. With only two days to go we have reached the time where forecasts are now becoming much more accurate. On average, forecasting accuracy drops significantly when you get 4-5 days out, yet several weather services produce 10-16 day forecasts! There are no excuses at this point with close to 48 hours to go! Today, I have completely taken out the chance of rain for Sunday leaving us with a partly cloudy afternoon. We should get some rain today and tomorrow though. Sunday begins another stretch of precipitation free conditions that we have been enjoying for the last week or so. After analyzing today's maps I will include a bit on how I forecast temperatures.

Surface
Most of the action remains to our south on today's models. The development of a second low near Alaska has also helped drag moisture further to our north that will follow that establishing ridge that shows up quite well on the 500mb map. Look at the big high pressure region to the north of Montana. That is really cold arctic air. Temperatures look to be in the single digits over the weekend with lows in the negatives for Montana, Wyoming, North and South Dakota (I just looked at the forecast temp for Lemon, SD...the HIGH temp is 3 for Sunday, ouch!).

850mb
We see the same thing happening at the 850mb level that we see close to the surface. The further up in the atmosphere you see features, the "deeper" they are considered. In this case, the lows are fairly deep, although it is not uncommon to see features all the way up through the 300-200mb level, like hurricanes. We see little hope for some cold air advection, which would stabilize the atmosphere. Nonetheless, we still are looking dry.


500mb
That big ridge is still lingering out near the coast. It acts as a wall that forces energy (PVA) up and over the ridge. This ridge also impacts our temperatures at the surface. Under them, locations can expect warmer than average temperatures. We will take a look at how this impacts our temperatures in a bit with the numerical forecast.


300mb
The weak jetstreak that we are dealing with looks more harmless today. It is pushing south, we call this "digging". Notice the little dip in the overall flow to our south. That is a small trough, caused by that shortwave energy. As long as the jetstreak stays on the LEFT side of the trough axis, we can expect that energy to "dig" and deepen that trough. That should send the shortwave even further south. In fact, it will impact southern California this weekend. For us, we will be enjoying dry and partly cloudy conditions.


Temperature
I haven't really spoken much about temperatures for Sunday yet. There are a couple ways I go about forecasting temperatures. As I noted in the into, forecast accuracy declines when you look to predict 4-5 days out. I typically do not use these maps for high and low forecasting. It is possible, however. A lot of forecasters use the air temperature at the 850mb (in degrees Celsius) that corresponds with a temperature at the surface (in degrees Fahrenheit). For Sunday's forecast, I have used two sources. One is the 2m surface temperature model that the University of Washington provides. It forecasts 84 hours out and uses 3 hour increments. This is about as high-res as we can get in forecasting for our area.
Forecasting a high temperature is easy enough using this method, assuming you have confidence in this model. Over a year's worth of forecasting has lead me to notice some trends (flaws, in my opinion) within the models. Every model is great at handling some aspects and struggle with others. As the map shows, we are right at the threshold of 48 degrees. I am holding onto hope that this model keeps us right there since that was my initial forecast temp!
Another method used to forecast is model output stats, or MOS. MOS is great for the Pacific NW, Oregon and Willamette Valley forecasting. Why? MOS has a strength in handling local effects really well. Local effects include the Pacific Ocean, Coast and Cascade mountain ranges and the Willamette Valley. All these things are taken into consideration. Here is what MOS looks like:
A lot of categories there! Some include dewpoint temperature, cloud cover, probability of precipitation for 6 hours, probability for 12 hours, type of precip, ect. What we are concerned with is temperature. You'll have to forgive the skewness of the graph but the first few days mostly line up correctly. Look at the row labeled "X/N". That is the nighttime/daily max temperature. Go to Sunday, 72 hours out (this was yesterday's model, they re-run at 0z, which is 4p.m. our time). MOS is expecting a high of...48! A great way to re-enforce a forecast! This particular MOS has several perturbations on it, about 20. The above is just one of those. I averaged all the perturbations and the temperature came out to about 47.5 degrees. I'm sticking with 48, why change based on half a degree. You got to own your forecast!!

Thursday, January 27, 2011

Day 4- Riding the Ridge

We are at the proverbial "halfway point" to Sunday. With each day, we have seen an increase chance in precipitation and not much change in the way of high/low temperature. We are on the cusp of getting much more data starting tomorrow. That is when multiple models start their Sunday runs. For the past 4 days I have been using extended GFS (Global Forecast System) models to forecast. GFS, NAM (North American Model) and more GFSx models will be available for use. Also, the University of Washington has a very good model system set up that uses NAM and WRF (Weather Research and Forecasting) model that specifically focus on the Pacific Northwest. That will help as well. So with more data means more information to sift through. This is where the fun really begins. But as for today's update:

Surface
Yesterday we saw a nice batch of moisture being pushed our way with the help from high pressure to our south and low pressure to our north. Today that moisture has been pushed back into the flow of the low pressure system. That moves the precipitation to the north and removes a good chance of rain for the majority of the day Sunday. Due to this, I have removed the showers for most of Sunday.
By the way, check out the Pacific weather charts as of today. You can see that area of low pressure that will eventually make its way into the Gulf of Alaska. It's sitting out in the middle of the Pacific. Pretty neat that we can see this coming from so far away!


1000mb
I am adding a new map to the discussion today. This is the 1000mb map and is essentially a surface map. Many locations around the state would call 1000mb "ground level". What I am looking for in this map will be re-enforced all the way up to the 500mb map today, more on this in a bit.
I have highlighted a few wind vectors. Wind vectors on this map indicate direction and wind speed. The longer the arrow, the faster the winds. Notice how the winds around Oregon spread apart from one another. This indicates that wind at the 1000mb level are diverging away. This is cause when air sinks from the upper levels. When we have air sinking, once it hits the ground the only thing it can do is spread out. Sinking air also denotes stable conditions and high pressure. This is another sign that our rain chance for Sunday is diminishing at this point.


850mb

High pressure off the California coast is still the dominant feature at 850mb. The low up to the north weakened on the maps from yesterday. There appears to be little to no warm air advection on today's map. That favors more stable conditions.
500mb
That pesky shortwave makes a return in today's map but it doesn't impact our forecast. What does impact the forecast is the ridge that has been re-established. This ridge is just off the coast. I would not be surprised to see this ridge move a bit more between now and 4pm Sunday. This ridge is re-enforced at the 1000mb level. Remember the divergence of wind on that map? It is a result of this ridging.


300mb

The jet streak we saw yesterday that was set to help with the precipitation has now left. It has sagged to the south along with that shortwave energy.
All in all, day 4 has brought an improvement in the forecast. I would say the only threat of rain on Sunday will be limited to the early morning hours. The first four posts have been strictly conditions updates. Tomorrow I will get into some number forecasting as various models and text models will begin to include Sunday. As of today, my initial numbers have held up pretty well!