Showing posts with label tornado. Show all posts

Friday, June 14, 2013

Forecasting Tornadoes In Oregon

It was just last month that I wrote about why the Pacific Northwest is not a tornado "hotspot". Of course, as a meteorologist, I should know better than to challenge Mother Nature like that. On Thursday, McMinnville was hit with an EF-1 tornado. No injuries were sustained but a good amount of damage was done to several buildings and highway 99W was re-routed around Lafayette. The twister was the first in Oregon for 2013 (Washington had an EF-0 storm in Battle Ground in March) and the first tornado since 2011. The Willamette Valley last saw a tornado back in 2010 when an EF-2 tornado struck in Aumsville. So they DO happen! But why can't we forecast these "cold-core" twisters that touch down in the Pacific Northwest?

Here is a snip-it of an essay by John Sauder, a Canadian meteorologist, who describes a "cold core funnel":
"A cold core funnel is a vertically tilted rotating column of air under a rapidly growing convective cloud, but the atmospheric conditions are different than those conditions that produce typical funnel clouds or tornadoes"

Imagine a typical Oregon spring rainy day. You know, those days where the weather doesn't seem to be able to make up its mind? Rain, sun, clouds, hail, sun, rain. The environment described by Suder above is very similar to those kind of Pacific Northwest days. Tornadoes in the Midewest and Southeast do not form this way. Tornadoes in "Tornado Alley" are much easier to see coming, not to mention much larger, and thus it is easier to forecast and issue warnings. No tornado or severe thunderstorm watches or warnings were issued with yesterday's McMinnville cell. 


Radar is an amazing weather product that helps meteorologist identify characteristics of a tornado. This radar image has almost NO characteristics of a typical tornado. Take a look at the radar comparison between McMinnville's tornado and the tornado that ripped through Moore, Oklahoma last month:

Glaring differences! On the right, the Moore tornado signature is a classic! This is what is known as a "Hook Echo", the rain shown wrapping around some very intense rotation. No such signature in the McMinnville radar image. The only similarities between the two appear to be rain intensity. The pink on both images show heavy rainfall and most likely hail present as well. The Moore radar had a Tornado Warning associated with
it, while the McMinnville did not. Why was no warning issued for yesterday's storm? Sauder offers up an explanation:

"...these cold core events happen on a small scale (mesoscale) and are typically rather short lived."

This would answer why it is so difficult to issue warnings on Oregon twisters. They just pop-up! Just like those showers and sun-breaks that are so common during our spring weather. Another tool radar offers up is called "velocity". That helps identify wind directions in a storm. Here is a typical tornado signature using the velocity tool: 
Tornadoes are often found right were green meets red. The different colors mean that winds are moving in opposite directions, and where they touch is where winds are spinning in a tight rotation. This velocity signature is one most tornadoes in the Midwest and Southeast contain. But here in the Northwest, we don't often see this strong of a signature. Sauder says,

"The velocity signatures are very small and usually blend in with background noise...makes cold core funnel or cold core tornado detection using radar almost impossible. This difficulty in forecasting such events results in short , if any, warning times for the public"

On top of the weak signatures, the elevation at which these signatures occur are rather close to the surface. The radar beam that sweeps over McMinnville hits at somewhere near 4,000 feet. That is too high to detect significant velocity circulations at the surface. 

All these factors challenge any meteorologist in the Northwest when it comes to tornadoes. Seeing the radar triggers described above in real-time make issuing watches and warnings much easier in other parts of the country than in our neck of the woods. So while these events are very rare and not significantly strong, the tornadoes we see still present a very real danger when the spawn. 

Wednesday, May 22, 2013

Understanding Tornadoes

It's something that native Oregonians don't fully understand--the anatomy and history of tornadoes.On average, Oregon sees one to two tornadoes every year. However, there is no comparing our twisters with those in the Midwest and South. A chief example, Moore, Oklahoma. The monster twister that rolled through the Oklahoma City suburb is just the latest in a storied history of the most active-weather state in the U.S.

It takes a perfect atmosphere for a tornado to form. Plenty of moisture in the air, instability, strong winds and ultimately, the trigger needs to be pulled to initiate storm formation. There is no better set up in the world than right here in the U.S. More specifically, east of the Rocky Mountains. The moisture roll player is the warm Gulf of Mexico. With mild water temperatures year around, the Gulf of Mexico provides plenty of "fuel" for storm development. All that warm air can travel freely over the land and deep into the Plains due to the lack of "elevated terrain". There is no physical barrier that would wring out moisture or block it from proceeding North or East or any direction until it reached the Rockies.

All that warm air then needs to be lifted. A typical lifting mechanism is simple day-time heating. As the sun breaks through the clouds, it warms the air and causes bubbles of lifting air. Those lifting bubbles then grab the moisture from the Gulf and sends it upwards. A cold front moving through the area will also do the trick. The boundary will help push the warmer, less dense air up and over the colder, more dense air.

So we now have moisture and lift. Next we need to create instability. Those bubbles of air won't continue to rise unless the air surrounding the bubbles is cooler than the bubble itself. That cold air comes compliments of Canada. The still-cool spring air sinks down from the north behind our cold front and interacts with those rising warm bubbles. This creates instability and allows storms to being to form. Those big, towering, white puffy clouds are a result.

Tornado Ingredients
Almost there. We have the storms brewing, probably just dropping heavy rain and hail along with some lightning and thunder. In order for a tornado to spin up, we require spinning air above the ground. That is provided by a westerly jet stream, or fast moving pocket of air way up in the atmosphere. That gets the air surrounding these big thunderstorms rotating at different speeds and at different directions. This is called "wind and speed shear". Once all of these ingredients are present, tornado watches and warnings must be considered.

Oregon lacks several of the ingredients previously listed. We lack a significant warm body of water to provide moisture. The Pacific Ocean along the U.S. west coast is a cold current body of water. Cool water helps stabilize the air passing over it. Thus, the air coming onshore in Oregon is more stable than the air coming in from the Gulf of Mexico in the South. Coastal and Cascade mountain ranges also pose an issue to the formation of tornadoes. The rugged terrain often disrupts organization of all the ingredients required. Lastly, we just don't have a good source of warm, moist air that can filter in to our area. The most common form of active weather we Pacific Northwesterns' get are summer time thunderstorms. A good southerly push of warm, more moist air from California will typically help spark those storms. I think most of us will take the grey, drippy days instead of a regular threat of severe weather.

The Moore, Oklahoma tornado was just a perfect recipe of weather. The tornado wound up being ranked at the top of the Enhanced Fujita (EF) tornado scale, which is a 5. The EF scale, a re-tooled scale of the original Fujita scale, remains based upon damage caused from the storm. National Weather Service workers will asses storm damage and then use that damage to estimate wind speeds from the twister. A common misconception is that tornadoes are ranked on wind speeds. Hurricanes are classified using their wind speeds. Back in 2007, the NWS implemented the EF rankings, slightly adjusting damage-to-estimated wind speed scale. You'll notice that the new scale does not include winds of 300+ estimated winds but the old Fujita did. It is widely suspected that tornado winds are the fastest winds on earth. The confusion between Fujita and Enhanced Fujita is a bit perplexing but it really shouldn't be. In my mind, they are almost interchangeable but I refer to them using "EF" just to follow along with the NWS.


I had mentioned above that the Moore tornado was officially classified as an EF-5. Since 1950, when the NWS implemented the Fujita ranking scale, 58 tornadoes received the top classification. Moore, Oklahoma made it 59. In fact, of those 59 F/EF-5's, 7 of them have ravaged the state of Oklahoma. That is more than any other state and compromises just over 8% of all F/EF-5 tornadoes in U.S. history. Needless to say, Oklahoma is "Tornado Alley".


Thursday, June 7, 2012

Spring 2012 in Pictures

Time for one of my favorite posts. We get tons of photos sent into the station from viewers across the state. The number one most sent in photo? Double rainbows. ALL THE TIME! People love a rainbow, people freak over two! Of course, double rainbow viewer photos spark all sorts of quotes. "Full on double rainbow" "What does it mean?" can all be heard throughout the newsroom! There won't be any rainbows in my pictures today, but still some awesome stuff from the spring season!

The first photo was sent to us by Chris Jense. Here, we are looking at an awesome convective process. The cumulonimbus cloud, commonly referred to as a cauliflower cloud, is built by a process of warm and cool air. The sun heats the earths surface and causes the air to warm and rise. The rising warm air is cooled by the atmosphere above and eventually it becomes a large cloud like the one above. At some point, the cloud can no longer hold the moisture. The result is a short, intense downpour that we see above. This specific cloud is still building. You can tell by the sharp edges of the top of the clouds against the blue sky in the middle of the photo. Notice the bands of rain pouring down over the Jack In The Box. That's some heavy rain and most likely some small hail mixed in as well.

Linda Sullivan got a sunset snapshot of a passing thunderstorm. Again, we see the cauliflower-style clouds that extend well up into the atmosphere. The higher these cloud tops bubble up, the stronger the "updraft" is from the surface. The updraft is that column of warm rising air from the surface into a cooler environment above. The stronger the updraft, the faster the air is rising. This style of cloud is typically associated with active weather. We had a few weeks of afternoon thunderstorms around the Portland-metro area towards the end of spring.

Another convective picture, this time sent in from a viewer along I-5. Love the contrasts in this picture. The lighter clouds against the blue sky on the right side shifts to the dark rain clouds and the rain shaft on the left side. That dark area is actually rain falling from the clouds. Again, we are looking at convective rainfall here. The rain falls when the updraft can no longer sustain the rain. The weight of the rainfall overtakes the updraft and the result is the rain core you see above!


Funnel clouds are not unusual for Oregon. Tornadoes are. A funnel cloud is just a rotating cloud in the air. It can't cause any harm unless it touches the ground, then it becomes a tornado. It can be difficult to identify a funnel cloud from a still photo. It needs to be visually confirmed or else it may appear to be a low-hanging cloud. This definitely has the look and structure of a funnel cloud, however. No tornadoes have been confirmed in Oregon for the 2012 spring.


A well-timed shot was sent to us from Estacada. That looks like an impressive bolt. Notice how it goes from cloud-to-ground. These type of strikes are the only ones that produce thunder. A cloud-to-cloud lightning bolt can put a nice charge into clouds, but no thunder is heard from it.

This winter weather wasn't limited to the winter season in Portland. This is a great shot from outside the station in the middle of spring! Portland saw near 5 inches of snow over the spring, making up for the usually dry first half of winter we had.

This tranquil photo was sent in by Barbra Lane from Parkdale, Oregon. An amazing, peaceful photo after a heavy dose of snow fell near Mt. Hood.The Cascades got plenty of snow this past winter and first half of spring. That should make for a great water recreation summer.

 This photo wasn't sent in to the station and isn't even from Oregon. This photo was taken in McCalla, Alabama. I am really hoping that this is the actual photo and not photo-shopped in any form. If this is a true photo, WOW! It looks like the lightning is striking the street! The clap of the thunder was probably ear-piercing. Very powerful!


Finally, a little bit of astronomy. The west coast was treated to a solar eclipse on May 20th. A solar eclipse occurs when the moon travels between the earth and the sun and blocks the sun from view on earths surface. Above is the western satellite view that caught the dark spot on the earths surface. The next eclipse will be a partial eclipse on October 23rd, 2014.

Spring offers up some of the best weather and thus, weather photo ops. I'll be monitoring the summer photos and will be sure to share any interesting pictures!

Monday, March 26, 2012

Weather Mythbusters

The popular Discovery Channel show "MythBusters" has busted a myth or two in regards to weather over the shows history. In my opinion, not enough is being done to inform the general public about weather phenomena or myths that exist out there. So I figured I'd address a few popular questions I get and straighten out some myths that I hear.

Myth: "It has to be 32 degrees in order to get snow"
Truth: No, it doesn't have to be 32 degrees in order for snow to fall. We are taught early on (elementary/middle school) that 32 degrees is the freezing point of water. Rain is water, snow is frozen water. Water freezes at 32, thus snow falls at 32 degrees! At its most basic, this is true. But it goes much deeper than that. As the precipitation falls from the clouds, the drops create a frictional drag on the air surrounding the cloud. If enough precipitation falls (i.e. heavy shower/downpour), the drops (or snow) pulls the cold air down along with it, briefly lowering a snow level. That means if your car thermometer is reading 37 degrees but your seeing snow falling on your windshield, the shower has pulled the colder air from above down to the surface. A surface temperature of 38 degrees or higher would be pretty tough to support snow. In order for snow to accumulate, we would need the surface temperature to be freezing. That often requires several hours of air surface temperatures of freezing or below. The ground is only cooled from the air-exposed side because the ground tends to warm from below. This bit of information leads into my next fact.

Myth: "Bridges and overpasses are the first surfaces to freeze"
Truth: Absolutely true. Roads that are suspended from the earth's surface will reach freezing before the surface streets. This is because roads on bridges and overpasses are cooled from above and below, as compared to surface streets that are just cooled from above.  

Myth: "If caught on the highway during a tornado, the safest place to be is an underpass"
Truth: This is a BIG no-no. You're better off in a ditch on the side of the road than stopping under an underpass. If a tornado crosses near or over and underpass, the underpass becomes a natural wind tunnel enhancing the winds as they pass under the road and making it a more dangerous spot to ride out a tornado. Along with the enhanced winds, an underpass creates a funnel for all the debris flying around the tornado turning debris into big bullets that can injure or kill you. If you can safely, exit the freeway and seek shelter in a nearby structure. But avoid the next myth...

Myth: "During a tornado, open the windows so that the storm won't damage the home"
Truth: Keep the windows closed! Here's the deal. Some folks think that the extreme pressure differences as a tornado passes will "blow up" or "explode" a home. Tornadoes don't "blow up" houses, it's damaging high winds rip the house apart. Opening windows won't equalize pressure from the storm to the inside of the house and won't prevent the tornado from destroying the house. All opening the windows does is invite that flying debris into the house and becomes another way that people can be killed from tornadoes. The best place to be in a house during a tornado is on the lowest level in a central location away from windows. If you have a bathroom with a tub, that works too.

Myth: "Hurricanes, Typhoons, and Cyclones are all different types of storms"
Truth: The only differences are where these storms form. They are all classified as tropical cyclones. Here in the Western hemisphere, we are familiar with hurricanes. In the Eastern hemisphere, they are known as typhoons (these storms often impact Taiwan, Japan, China). The term cyclone describes a tropical cyclone that forms in the Indian Ocean. Australia and surrounding areas have their own name for tropical cyclones, known as Willy Nillys.

Myth: "Water drains opposite in the Southern hemisphere"
Truth: This isn't exactly a "weather myth" but it is founded on a key component that is utilized in meteorology. First off, the myth is NOT true. Toilets flush the same way and water drains the same way in both hemispheres. But there is a difference in rotation on a larger scale between the two hemispheres. Here in the Northern hemisphere, our storms (known as cyclones) rotate in a counter-clockwise fashion. This is due to a force known as the Coriolis Effect. Coriolis essentially is an apparent deflection to the right as the earth rotates. Next time you take a plane ride, open up the in-flight magazine and check out the flight paths of the airlines. You'll notice that the paths are in an "arc" shape. If you tried to fly in a straight line from Portland to New York, you'd end up somewhere in Florida! So flight plans over-correct for this "deflection" to the right and the path becomes arc-shaped. The same thing happens in the Southern hemisphere, except the deflection is to the left. If you apply the Coriolis Effect to cyclones in the Southern half of the earth, cyclones will spin clockwise.
So if storms spin in opposite directions in the Southern hemisphere, why doesn't water drain in the opposite direction too? The Coriolis Effect only impact to large-scale features. The water in toilets and sinks are on too small a scale for any impact.

Myth: "It's a Monsoon out there!"
Truth: The above statement is often uttered when commenting on a heavy downpour. However, a monsoon is not a rainstorm. A monsoon is defined as a seasonal reversal of winds. The rains are just a result of the changes in winds. During the summer months, winds will come off of the ocean onto the land. That results in lots of rain as the air moving inland is very moist from the ocean waters. While the rains are the most well-known result of a monsoon, there is also a "dry" monsoon that occurs during the winter. As the winds reverse in the winter, air flows from land to sea. The air is much drier over land thus, the "dry" monsoon. A few of the famous monsoons are the South Asian (Indian) monsoon and the SW US monsoon (Arizona, New Mexico, Nevada, California, Utah). Oregon doesn't have a monsoon despite being located next to the ocean. We do see an impact of the SW US monsoon sometimes during the summer when afternoon thunderstorms pop up in a southerly wind setup. But now you know that when it rains, it's no monsoon!

How many of those did you already know? Do you have any questions you'd like answered?


Tuesday, January 24, 2012

Media and Weather

The first deadly severe weather outbreak of 2012 occurred Sunday overnight into Monday in parts of Arkansas, Tennessee and the Gulf Coast states, an area known as "Dixie Alley". Already hearing reports of multiple EF-3 tornadoes and that total may increase as field analysis will be conducted over the next few days.
Whenever Mother Nature strikes, the media is sure to follow. Last night, ABC's national news began their coverage with this lead-in:


Video courtesy of Alabamawx.com

The lead-in is absolutely misleading. The wording of the script gives the illusion that forecasters in the region failed the public.  In NO way was this mini-outbreak a "surprise" event. I was aware of this event days before just by following social media posts of meteorologists who work in the area. Folks in the Midwest and South should naturally pay more attention to forecasts and warnings issued by their meteorologists. And for several days, this event was projected to happen. Look at this blog post by one of the top meteorologists in the Alabama, James Spann. Citizens in the impacted areas had at least 24 hours notice that a dangerous weather event could occur and areas under Tornado Warnings had at least 20 minuets of lead time, according to Spann.

Most people are aware of "Tornado Alley" where the highest concentration of tornadoes occur anywhere on Earth. What most people do not know is that there is a second "alley", known as "Dixie Alley" (Arkansas, Tennessee, Louisiana, Mississippi, Alabama and Georgia) that is just as dangerous. Within this region, a secondary tornado season exists during the winter months! Take a look at these graphs that compare Tornado to Dixie Alley:
Notice the spike of strong and deadly tornadoes in the winter months that occur in Dixie Alley as compared to the Plains (or Tornado Alley). A drastic difference. To compound the danger that Dixie Alley presents, take a look at this graph:

Late afternoon-evening-overnight storms add to the danger of Dixie Alley outbreaks. These tornadoes often strike while people are on their way home from work or sleeping. It's tough to follow storm coverage when your asleep. This is why Spann often promotes weather radios that allow emergency broadcasts to be issued when danger is on the way. A great tool to keep people safe when not near a television.

Tornadoes do not spawn randomly. A meteorologist that is worth his or her weight in gold can forecast the threat for tornadoes a few days in advance using weather maps. It is nearly impossible to forecast the exact track of a specific twister, however. But with ample warning time, it shouldn't matter.

Current and accurate weather information is important in any extreme weather situation, regardless of location. James Spann has perfected the art of T.V. meteorology with his policy of wall-to-wall weather coverage if ANY county within his stations' viewing area is under a severe weather warning (sorry, Judge Judy fans!). With coverage that extensive, there should be no excuse for saying these tornadoes struck "without warning"! So why does the media come out and state exactly that? Was it because people died? Or are certain media outlets just that lazy and decide to spin their own story out of what happened?

I've found in my time working in television that weather is often disregarded when it comes to accurately reporting on events. I have heard many stories on various news channels that incorrectly mention current or past weather conditions and events. Weather here in the Pacific Northwest is not as extreme as the weather in other parts of the country. We are not familiar with the severe weather that  the Plains and Gulf Coast South deal with on a seasonal basis. That is something I plan to fix!

I have worked with people who are familiar with weather and who REALLY do care about the accuracy of the story they are writing or giving. But there are times when I have to shake my head when I listen to an inaccurate report  I often encourage my co-workers to talk with me about current weather conditions if they are unsure of what to put in scripts or say on air when talking about a weather story. It is important to relay proper information to the public when it comes to watches and warnings. Not only from a meteorology standpoint as it could save lives, but also from a journalistic view as well. 

There are reports that meteorologist James Spann will be interviewed by ABC regarding the aftermath of the tornadoes. Hopefully he will set the record straight on national television, much unlike Diane Sawyer the night before. 

Tuesday, November 8, 2011

Oklahoma!

Recall spring and early summer here in the Pacific Northwest....
Portland had one of the worst springs of all-time! It ranked as the 4th coldest and 2nd wettest spring on record. The average temperature for the 2011 spring period (March-May) was 49 degrees. We received 14.41" of rain as well, 0.9" shy of tying the all-time record. Given the two, I'd say that's a pretty miserable stretch.

While we "suffered" here in the Pac NW, it compares very little to what the Sooner State has endured since January 1. Oklahoma has gone through a variable mixed bag of extremes this year. Let's review:

February 10:
In Northeast Oklahoma, Nowata recorded the state's coldest temperature ever when the mercury disappeared to minus 31 degrees Fahrenheit! That record stood for 64 years and previously was minus 27 degrees.  Also ending that day was the new state record for snowfall in 24 hours. Just to the Southeast of Nowata, 27" of the white stuff fell in Spavinaw! Winter Canadian air was to blame for these winter records.

Let me draw your attention to the top left map. This is the setup for February 9th. Notice that over Oklahoma, the pink colors are moving from the north to the south. This indicates very cold temperatures in the atmosphere above, an "arctic outbreak". Those temperatures above translate into cold temperatures at the surface. The map on the bottom right displays relative humidity through roughly half the atmosphere. The pink colors indicate a "dry" atmosphere, or low humidity levels. The brighter blues tell us that the atmosphere is saturated and wet. The more saturated the air is, the more likely precipitation is to fall. There is a bulls-eye of high saturation over Oklahoma on the 9th. Combined with the cold temperatures, we get the beginning of a record snow event!

February 9 setup

On the 10th, notice that Oklahoma looses it's moisture source. The record 27" of snow fell out of that saturated air but dried out quickly after. When the atmosphere is dry, that typically means there are no clouds in the sky. A clear sky allows heat from the day to escape out to space and rapidly cool temperatures at the surface. This is how you drop temperatures to minus 31 degrees!
February 10 setup

May 23:
Oklahoma lies in the middle of what is known as Tornado Alley. More tornadoes occur here than anywhere else in the world! The threats from tornadoes includes hail and high winds. State records were set in both categories in a two day span beginning on the 23rd. A record 6" hailstone fell in Guetbo. Below damage to a roof of a car that collected the hailstone.

May 24:
A tornado outbreak near El Reno caused a scientific wind gauge to record a wind gust of 151 miles per hour as the tornado passed. That gust crushes the previous record of 113 miles per hour that was set back in 1994.


July:
A majority of the country baked this summer in record heat. Oklahoma was at the top of that list.
Temperatures Compared From Average

 Oklahoma averaged a July temperature of 88.9 degrees. This is not the average high temperature. It is the average temperature felt at any point in Oklahoma for the month! It has never been that hot in any state for any month, ever! Truly remarkable.

Summer: 
The summer never provided relief for Oklahoma. Mark Shafer, director of climate services for the Oklahoma Climatological Survey said that at one point 99% of Oklahoma was experiencing severe drought.

November 5:
From the non-weather department but still significant and record-setting: Oklahoma experienced its strongest earthquake on record. A 5.9 magnitude earthquake struck near Sparks. It was a shallow earthquake, which allows the earthquake waves to travel longer distances. Earthquakes are nothing new to Oklahoma. Given the states proximity to one of the United State's major fault lines, the New Madrid fault, earthquakes from that seismic zone probably impacted Oklahoma in the past. There are several known fault lines in Oklahoma and while it is not in a perceived "earthquake zone", its location still can produce sizable quakes.

2011 has been a torture on Oklahomans. What does all this extreme record-setting phenomena mean? I wish I had an answer for that but I'll let you draw your own conclusions!


Monday, September 26, 2011

Joplin, Revisited

The NWS put out their final assessment of the infamous EF-5 Joplin tornado that occurred on May 22.

The report didn't touch much on the final death toll. 159 people lost their lives in the tragedy, the most from a single tornado since 1953. The report also didn't cover the damages caused.

What the report did cover, in great detail, was the processes that lead up to the warnings being issued ahead of the tornado and the response the citizens took to protect themselves. The findings of the report are somewhat surprising!

The NWS Assessment team took an ethnographic approach to conducting some of it's research. The report stated that ethnographic techniques were used to, "Understand residents points of view regarding the process of warning receptions to warning responses and how decisions were made."

I am big fan of this approach. It definitely helps to know your target audience, in any situation! Understanding the thought process of the citizens is a huge first step to improving warning timing and distribution. Over 100 people were interviewed for the report. One of the more important findings was how the people in the path of the twister processed the warning information.

In this day and age, social networking is huge. Facebook, Twitter and text messaging are huge communication tools. These are great ways to get information out. Meteorologist James Spann, who covers the Birmingham, Alabama market, has utilized these tools about as well as anyone can. He sends out tweets and posts that pertain to weather watches and warnings in any part of his television viewing market. There is great potential in social networking when it comes to severe weather. The problem with it is two-fold. First, not everyone uses social media. Those who don't would then have to find their warning information elsewhere. The second problem to this is validity. Not everyone who is posting about a tornado or thunderstorms are trained experts. So there could be a lot of false information flying around out there.

Social media can be one method of risk awareness. What are others? Many towns in Tornado and Dixie alley have tornado sirens. Weather radios are common as well in these parts. T.V. weather reports are the best way to get access to severe weather information. In Joplin, it is "community policy to sound sirens when a tornado is moving towards Joplin OR a severe thunderstorm with expected winds to exceed 75 m.p.h." This causes a big problem.


When the sirens go off, what are they warning for?!?! There is a large difference between a severe thunderstorm with damaging winds and a tornado. While both can be destructive, a tornado is far more deadly than strong winds. There needs to be clarification between the two events. The people in Joplin on May 22nd had to process two different blasts of the siren. This should have been all it took for people to act. However, the report found out that people acted, "after processing a variable number of risk signals...". In a deadly, EF-5 tornado situation, people can not afford to take time and contemplate a "variable number" of warnings. There were many reports that people did not act until they visibly saw the tornado! Why weren't the sirens enough?

Several people who were interviewed said that tornado sirens have lost their credibility. A few of the responses show why:
 "the sirens have gone off so many times before"
"bombarded with sirens so often that we don't pay attention"
"...[the sirens] go off for dark clouds"

These responses go to show that people who live in tornado-prone areas are probably desensitized to the sirens. Folks would point to data to prove why they treat the sirens with such complacency. In all tornado warnings issued by the NWS nationally, it was found that over 75% of the warnings were false alarms. That information was averaged over roughly the last 4 years. So it is easy to see why people assume that a tornado siren is just someone crying wolf! But here is the bottom line, every environment is different. On this particular day, the environment was primed and ready to fire off dangerous, long-track storms. So you just don't mess with weather, even if it means you have to take to safety for 20 minuets or so.

What needs to be done to prevent this confusion and complacency again? It is critical that the NWS, media members and community officials are on the same page when it comes to warnings and stressing immediate action. Sirens need to be blasted for one type of event only. A reverse-911 action plan may help as well. Anything that puts emphasis on the danger of the situation and allows enough time for action to be taken.

This problem of complacency runs far past tornadoes and Joplin, Missouri. When faced with an approaching hurricane, several people disregard warnings and evacuation requests to ride out the storm because they think that the weather man is wrong, or that it would never happen to them. It is downright foolish to challenge mother nature. The minuet you don't respect it, it can take your life. 

Here is the link to the full NWS Joplin Tornado Assessment


Friday, June 3, 2011

Portland's Spring Weather: In Pictures

One of my favorite parts about my job are the viewer emails that we receive on a daily basis. Most emails are VERY opinionated stances on stories or programming (one of my personal favorites being a complaint about the station not airing a classic Perry Mason re-run. You know, the one where Perry wins the case?). Those emails are a story for another day. But during crazy weather times, which we have had plenty so far this year, we do receive some very cool photos! I thought I would share a few of them with you all.

This first photo was taken earlier this Spring. These are some of the most unique cloud forms, it's easy to see why! Sometimes referred to as flying saucers or "the mothership", the scientific name for these clouds is "lenticular clouds". They form over hills or mountains as moisture in the atmosphere is forced to rise over the geographical barrier and forms a cloud. The size of the cloud is normally determined by the jet stream above, causing shear to the cloud, or tearing of the cloud. In the above photo, you can see the jet stream is pushing the cloud from the left side of the photo to the right. Look at the top right-hand side of the cloud. You can see the tops of the cloud being pushed down-wind (to the right). These clouds will appear stationary, giving it that hovering, "mothership" look. In fact, the cloud is repeatedly fed moisture from the air and just re-generates a new cloud. As the air moves down the back side of the hill or mountain, the moisture in the air evaporates, thus no cloud! If you look towards Mt. Hood on a clear day, you can often see a "cap" over the top of the mountain. The cool thing about lenticular clouds is that they don't generate any precipitation and are typically a sign of fair conditions!

Our next photo depicts a visually stunning but dangerous cloud!
This photo was sent in from Woodburn. But it looks very similar to a cloud that people in the South and Midwest have seen lately. I am fairly certain that this is a cloud known as a "wall cloud". The reason why I am not 100% sure is that in order to confirm it, there would have to be rotation. But judging from the photo, I feel confident that this is a rare wall cloud in Oregon! Why is this cloud rare in Oregon? Because we only average 2 tornadoes a year! This low-hanging cloud formation is often a significant indicator of a tornado. This storm setup has a large amount of air at the surface being sucked into the storm. Imagine air from the left side of the photo being sucked into the central portion of the storm. As the air gets sucked into the storm, it quickly cools and condenses into a cloud that forms at a lower elevation. Research has shown that the lower the level of the wall cloud, the more likely a tornado is to spawn. All that being said, this storm did not tornado. The environment has to be just right and most times the ingredients just aren't there for the development of tornadoes. But if you notice this low-hanging cloud in the future...probably best to take cover, just to be safe!

The final picture I have today could be considered a cloud "relative" of the wall cloud.
What we are looking at are the low-hanging clouds at the base of the ominous dark cloud. The clouds appear right above the rooftops of the buildings in Vancouver. While very similar to a wall cloud, these clouds known as "scud" are actually smaller, often rugged individual clouds. Scud clouds form when moist, cool air falls out of the storm, this is known as the outflow. The outflow forces the warmer air around the outside of the storm to rise. As the warmer air rises, it cools and forms a cloud. So these Scud clouds are indicators of a cool outflow from the storm!
It is easier to make out the individual clouds in this photo. They just kind of linger around the base of the storm. Because they hang around the base of the storm, they often times get confused as wall clouds. This is not the case as Scud clouds do not spawn tornadoes.

There was a brief look at what has been happening around Portland this spring. The wall and scud clouds are very rare for Oregon and the NW as a whole but do occur. Lenticular clouds, on the other hand, are quite common for us. The Cascade mountain range offers us plenty of opportunities for lenticular development on top of all those mountains!

Wednesday, April 27, 2011

Severe Weather

We here in the Pacific Northwest are moaning and groaning about below average temperatures and wet weather. Meanwhile, the Midwest, Southeast and Ohio Valley are being pounded with round after round of severe weather. It is just one wave after another of tornadoes, hail and damaging winds for these states. By the way, many of these states endured record snowfall totals during this past winter. Breaks in the weather have come at days at a time, but no real relief has been offered since the beginning of April. The numbers from the Storm Prediction Center really tell it all.

Here are preliminary tornado reports over the last 5 days. Keep in mind these are preliminary, and will take a while to officially be confirmed:Tuesday, April 26: 54 tornado reports Monday, 25: 44- one tornado may receive a EF-5 rating in Arkansas. Sunday, 24: 13 Saturday, 23: 9 Friday, 22: 28
That is an ugly stretch of storms. They were spread out across all of the Midwest and South. But that stretch of 5 days does not compare to reports a few days earlier. On April 19th, the SPC had
77 reports of tornadoes mainly in Missouri, Indiana, Illinois and Ohio. That was the third-highest total for the month so far. A few days earlier on the 16th, 139 unconfirmed tornado reports across North Carolina and Virginia. And the most reports of tornadoes for April came on the 15th when 146 reports came in from Mississippi and Alabama. In all, 654 reports have been made for the month of April, according to the Storm Prediction Center. Again, they are preliminary and it is possible that not all will be confirmed as tornadoes.Take a look at this map that shows the distribution of tornadoes so far this year (notice one in Oregon! It received an EF-0 rating). Often times, severe wind damage can be confused as tornado damage. It is the job of the NWS to analyze storm damage in person. This process is what gives us tornado ratings. Often people think that the Enhanced Fujita ranking system is based upon wind speeds when it actually is based upon damage.
How does this April's reports compare Aprils' past? In 2009, 226 tornadoes were confirmed. The 3 year average for April is 185 tornadoes. So, should all 654 reports be confirmed, that would be more than twice the 3-year average for the month of April! Incredible.
What's even more incredible is that the peak tornado season hasn't even started yet! That
distinction belongs to May with a 3-year average of 322 tornado reports. May also holds the all-time record for tornado reports of 543 in 2003.
What is the possibility of all 654 April reports this year being confirmed? Given the large number of reports, it would be hard to imagine that all of them were tornadoes. But all we have to do is look at January 2011 for evidence to the contrary. There were 10 preliminary reports of tornadoes this January. The actual report of tornadoes by NOAA was 16 (that also stands as the total number of official tornadoes so far this year, but February doesn't have official totals yet). So it is possible that these reports will be confirmed.
Along with severe weather comes loss of life. Over the decades of weather reporting and forecasting, deaths resulting from severe weather has improved greatly. More information at the fingertips of forecasters means improved warning systems. But the shear amount of storms this Spring season is starting to take its toll. April 2011 has 43 confirmed deaths from tornadoes. The 3-year average is only 6.
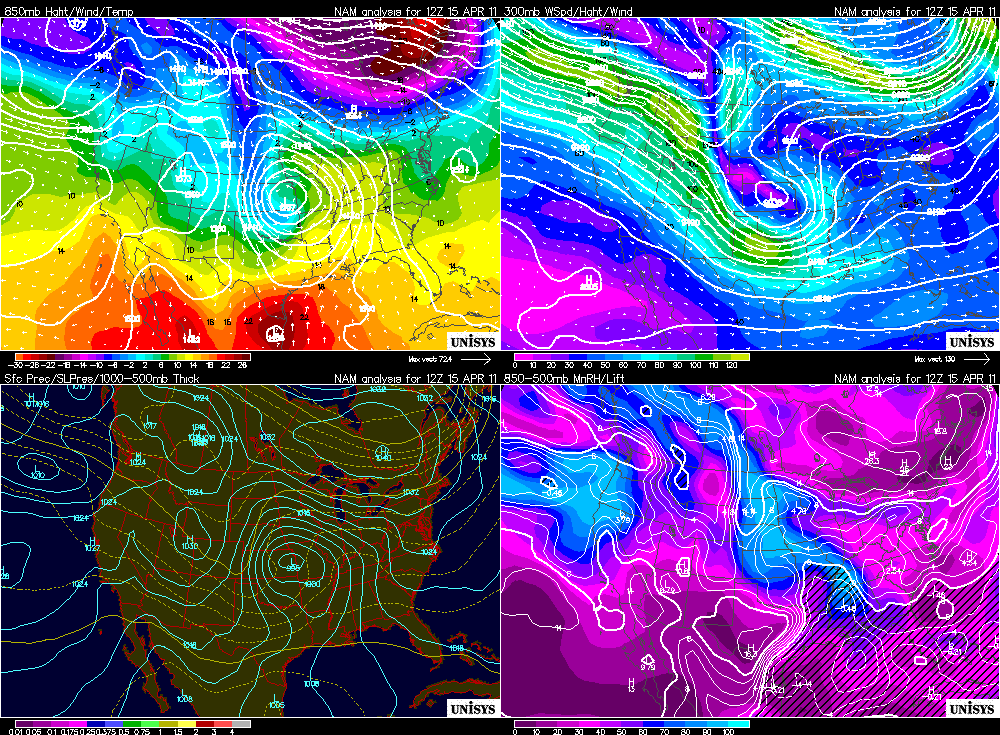
So WHY is all this happening? Let's take a look at the charts and find some similarities between April 15, 16, and 19.
Here are the charts for the 15th around 5 a.m.

The maps we want to analyze are the two upper maps. The one on the left is the 850mb map. Look towards the Gulf Coast. Notice how warm, moist air is pouring in off the gulf into Louisiana and Mississippi indicated by the warmer colors. That causes instability and uplift in the atmosphere. The map to the right is the 300mb map. This shows the position of the jet stream. A strong, westerly stream is preferred for severe weather. That is exactly what we have. Lots of warm air, plus strong westerly jet is a great recipe for storms. Watch this as it moves east on the 16th. Here is the setup for April 16th around 5 a.m.

Now all the action has swung to the east. Cold stable air is now pouring into Louisiana and Mississippi a day after the severe storms and the warm moist air is now being forced up the eastern Atlantic. This was an interesting situation where the warm Gulf moisture was being sucked up and mixed in with the warm Atlantic moisture off the east coast. The warm air, plus a strong jet stream on the 300mb map that is evident over the Carolinas spawned a tornado outbreak of record proportions in North Carolina. It definitely helped that the storms really were initiated the day before over the south and continued as they migrated towards the east. But another thing that aided these storms the Appalachian Mountains. As air descends down the mountains, it is forced to stretch. Imagine an ice skater that is spinning. As the skater pulls their arms in, they spin faster and faster. This is conservation of momentum. That is what the air is doing as it travels down the back side of the Appalachians. The air is warming, compressing and spins a bit faster in order to conserve energy. A perfect setup for tornadoes. A few days later, it was the Ohio Valley's turn.
Here is the setup for April 19th
Overall, this setup isn't much different than the initial outbreak on the 15th. There is a tighter low over the central part of the country again that is pulling the warm air from the south. The broad cool air stretches east-west along Ohio, Indiana, Illinois. That is our target. A strong jet stream just to the north of those states helps enhance the storms. The main factor though is the tight gradient between the warm and cold air. In the lower left hand map, you see surface pressure plotted. The main feature is that low. The bulge in the isobars protruding eastward is the warm front. It shows up nicely on the 850mb map as well, huh? This system resulted in those 77 tornado reports!
So knowing that April could set a record for confirmed tornadoes, what does that mean for May when historically we see the most tornadoes? We don't know. The broad scale weather pattern is always changing. We can only see 3-5 days out in regards to issuing credible severe weather threats. So in that sense, there is no use in forecasting out any further. In my eyes, it is smart to only look ahead one day at a time. As of today, looking ahead shows a slight break for tomorrow. A break which will be much needed for many as clean up efforts have been hampered by more storms. The actual number of tornadoes will take a while to be confirmed but given what is going on, take solace in the rain and mid-50's.

****UPDATE****
Yesterday's storms that ripped through the South added to what will no doubt become a historic and infamous April. Various reports have the death toll reaching 194 as of 6 a.m. this morning. No doubt that number will rise as the clean up effort begins in earnest this morning. I would assume that there would be potential for an EF-4 or even EF-5 rating out of this outbreak given the reports and videos.
There have been 162 reports of tornadoes from yesterday, making it the most so far this year. As I mentioned yesterday, most likely not all will be confirmed as tornadoes and some reports may even be of the same tornado. While watching coverage yesterday, news stations in Birmingham, Alabama caught a twister that may have been on the ground for 45 minuets! It is tough to put this event into words, so I'll let the pictures do the talking.

Tornado caught in Tuscaloosa, Alabama- one of the hardest hit areas- via Crimson Tide Productions:

4-27-11 Tornado Tuscaloosa, Al from Crimson Tide Productions on Vimeo.


A days worth of action caught by the guys from TornadoVideosdotnet-


Photo snapped by a reporter for WBRC as people take shelter in Cullman, AL
http://twitpic.com/4q93rs

Another video from Tuscaloosa. Not sure who to give credit to, but it isn't me...


An image from Twitter of the damage from Tuscaloosa, completely demolished- via @danamlewis
http://www.twitpic.com/4qaxnn

This monster skirts just past Bryant-Denny Stadium, home of the Crimson Tide-via Clay Hasenfuss

Tuscaloosa Tornado (4/26/2011) by sportsxbrooks