Let's peak at the numerical data first:
| FCST Hour | Valid Time | Max Temp | Min Temp | Td | 10m Wind mph | 850mb Wind mph | Total Precip(") | Conv. Precip(") | 500-1000 THKNS | 500mb Height | 850mb Temp °C | 500mb Temp °C | MSLP mb | Total Cloud Cover |
| 192 | Sat 09/01 06Z | 61 ° | 58 ° | 58 ° | N 18 | N 7 | 0.00 | 0.00 | 563 | 578 | 12 ° | -11 ° | 1016 | 0 % |
| 204 | Sat 09/01 18Z | 60 ° | 56 ° | 57 ° | N 13 | NNE 13 | 0.00 | 0.00 | 562 | 577 | 12 ° | -11 ° | 1017 | 5 % |
| 216 | Sun 09/02 06Z | 61 ° | 57 ° | 55 ° | N 18 | NNE 13 | 0.00 | 0.00 | 563 | 577 | 13 ° | -12 ° | 1016 | 35 % |
| 228 | Sun 09/02 18Z | 60 ° | 56 ° | 46 ° | N 11 | N 11 | 0.01 | 0.00 | 561 | 576 | 12 ° | -13 ° | 1016 | 46 % |
| 240 | Mon 09/03 06Z | 61 ° | 56 ° | 34 ° | NNW 13 | N 7 | 0.02 | 0.00 | 561 | 575 | 12 ° | -13 ° | 1016 | 74 % |
| 252 | Mon 09/03 18Z | 59 ° | 56 ° | 32 ° | NW 7 | NNW 4 | 0.02 | 0.00 | 559 | 574 | 11 ° | -14 ° | 1017 | 76 % |
| 264 | Tue 09/04 06Z | 60 ° | 57 ° | 48 ° | NNW 13 | NNW 9 | 0.02 | 0.00 | 557 | 573 | 10 ° | -15 ° | 1018 | 81 % |
Highlighted are the times for September 3rd. Our mid-level air temperatures are right around 10 degrees Celsius. This should translate to a surface temperature in the mid-70s. The big change from the last post shows that we have a precipitation chance through the day, calling for 0.02". September 3rd actually averages 0.03", so rain isn't unusual. What you can't see is that with each model run (GFS runs 4 times per day), the precipitation forecast changes. The waffling of the runs tells me that the GFS is trying to pick up something on the maps, so lets take a look.

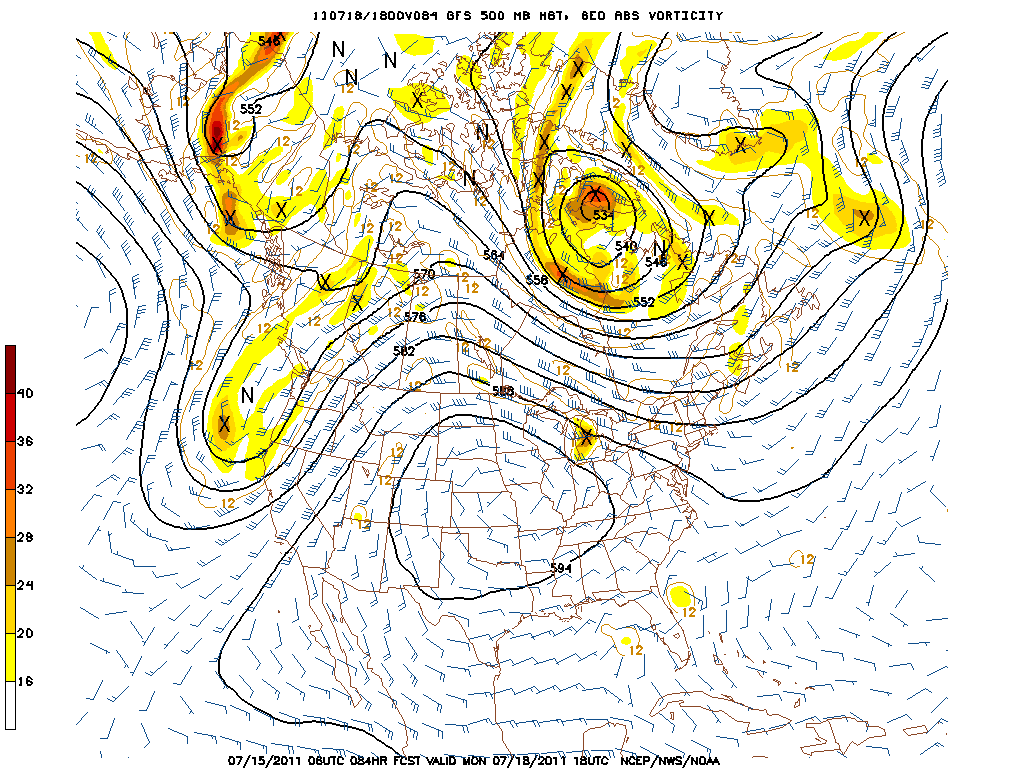
The 500mb map offers a pretty good hint as to why we are seeing some precipitation in the forecast. Notice the large bump over the middle part of the country. A nice ridge of high pressure dominates a good chunk of the U.S. and that causes a kink in the weather pattern on both coasts. This setup is known as the "Omega Block" named after the Greek letter Omega. Generally, fair conditions dominate over the central U.S. and both coasts would see some potentially unsettled weather. This would explain the cooler than average temperatures as well as the hint of precipitation that numerical data has been showing at times. Coincidentally and totally unrelated, a tropical storm/hurricane is the big feature on the east coast.
So, the forecast 10 days out goes something like this: I'd expect partly to mostly cloudy conditions with a slight chance for a shower. If I saw this setup on September 2nd, I would not put a rain icon on the forecast, but it is definitely worth a mention. With 10 days to go and the flip-flopping of the model output, there are still no concrete details. Stay tuned, only three more days until September 3rd hits the seven-day forecast!