Showing posts with label Pacific. Show all posts

Wednesday, July 18, 2012

Portland and Thunderstorms

Often times when we forecast the chance for thunderstorms here in the Portland-metro area, we get e-mails from viewers who would like to know very specific details when it comes to when, where and why. In an attempt to provide you with a better understanding of how we get these thunderstorms (and how we get the weather we see in general), I will be writing a series of posts that break down these weather set-ups.

Summer-time thunderstorms are not uncommon for Portland. In the Willamette Valley, we average less than 10 thunderstorm days per year. Since 2012, we have averaged 5 thunderstorm days. The "stormiest" month of the year is actually July. July 3rd, 13th and 22nd are actually three of the stormiest days of the year over the last 13 years! So why during the summer do we see thunderstorms? There are a few ingredients.

In order to get summer thunderstorms in Portland, we need daytime heating. The hottest time of year for us is mid to late July when we have a daily average of 82 degrees. When the sun is out and heating the earth's surface, that causes air to bubble up from the ground and rise in the atmosphere. As the air bubble rises, it cools. As long as the air bubble is warmer than the air it is rising through, that bubble will continue to rise on its own. The typical temperature profile of the atmosphere is for temperatures to cool as you go higher. You can imagine that on a 80 or 90 (or occasional 100) degree day, the bubbling of air is going to rise quite high on its own. This gives the air instability.

Now that we have a rising bubble of air, we must add some moisture to the atmosphere or thunderstorms will not occur. How do we get moisture into the air? We often see a general southerly flow through the atmosphere on thunderstorm days. That southerly flow provides us with moisture from the more mild Pacific waters off the coast of California as compared to the waters off of the Oregon coast. The southerly flow helps push that moisture north into our area. So we have added moisture to our rising, unstable air bubble and now we can create a cloud that has potential to create lightning.

Our final step is a trigger needed to agitate the atmosphere and spark the thunderstorm. There are several different "triggers" that can help us out. One is a front, be it warm or cold. During the summer we don't see a lot of warm or cold fronts so this isn't a common summer-time trigger. Strong winds in the higher levels of the atmosphere can also aid thunderstorm development. The winds help evacuate those rising air bubbles at the top of the atmosphere and prevents air from sinking back down. A "vorticity maximum" can be a good summer-time trigger. A vorticity max is basically a kink in the overall flow of the atmosphere. Think of it as a mini-low pressure system. As this passes over head it would be the last little push that would give our rising bubble that last ingredient and a thunderstorm would develop!

Over the last few days, Portland has had the threat of some afternoon thunderstorms. Yet, we have not seen those develop over the metro area. Here's why:


This is our 500 millibar chart valid for Wednesday at 8 am and is a snapshot of the happenings half way up the atmosphere. The main feature is obvious, a closed low pressure system off the Oregon/California coast. Notice the wind barbs flowing around the low. This has been the weather setup for the last couple days. A generally southerly flow winding into the Portland area. With the summer-time heating, south flow and some good moisture (you may have noticed a "muggy" feeling the last few days) thunderstorms looked like a strong possibility. Our problem? We lacked a trigger! This upper low would have been the PERFECT trigger for us but due to its location being so far away from the metro area, that doesn't help! This setup did have some strong upper level winds but they were located over central and eastern Oregon thus helping fire off some severe storms in those parts.

Thursday's setup looks a bit more promising for storms here in Portland.

 To the left is a different view of the 500 mb chart we saw above. This shows the low moving back to the north around Thursday evening. The feature to look at however is the dark red dot just east of Portland. That is a vort max trigger. With the low closer to us, plus this vort max, I see a good setup for storms.

The next map shows rising and sinking motions at nearly 10,000 feet. There is a dark red dot right on top of Portland at the same time as our vort max. The red dot is telling us that we have rapidly rising air occurring at that time. This probably due to the forecast high of 83 degrees Thursday. Now we have two ingredients: rising air and a trigger. Just need that moisture.
Finally, our precipitation map is showing a very heavy cell just southeast of Portland at the same time as our rising air and trigger mechanism. The models are showing plenty of moisture as well but the models are not always right! However, as I see this on multiple forecast charts, I would definitely keep an eye to the sky tomorrow late afternoon and into the evening. 

Wednesday, September 14, 2011

La Nina Returns?

NOAA has put out a La Nina Advisory for the 2011 winter season. That's right folks, La Nina appears to have re-developed and is here to stay a bit longer than first thought.

What exactly does La Nina mean, you may be asking? It essentially is a cooling of Sea Surface Temperatures (SST) in the central and eastern portions of the tropical Pacific Ocean. The set up has warmer than average SST's over the western Pacific and cooler than average SST's in the central and eastern Pacific. La Nina typically occurs ever 3-5 years but consecutive episodes occur nearly 50% of the time, according to the NOAA Climate Prediction Center. While La Nina stems from the anomalies of SST's, its impacts go way beyond ocean temperatures.

Sea Surface Temperatures showing a cooler eastern Pacific which signals a La Nina return. Via NOAA CPC.
Winter of 2010 in the United States was a record-setting one. High snowfall totals lead to record Spring flooding and severe weather that was off the charts! The exceptional drought that is on-going in the South...yup, put that one on La Nina. Wichita Falls, TX became the first location with 100 days at or above 100 degrees this year! So the news that La Nina has reformed does not offer much in the way of relief.

What can we expect for winter 2011? Average La Nina winters cause wetter than normal conditions here in the Pacific Northwest and can often expect cooler than average temperatures, too. La Nina doesn't offer much drought relief during the winter months either for those in the South and Southwest,
“This means drought is likely to continue in the drought-stricken states of Texas, Oklahoma and New Mexico,” said Mike Halpert, deputy director of the Climate Prediction Center.  
 
Typical La Nina setup
Beyond the upcoming winter, it is tough to tell just how long and strong La Nina will be. Should it last into next Summer, it could mean another active hurricane season. During the 2010-11 La Nina conditions, forecasters predicted a very active tropics with 14-19 named tropical storms. As of today, we are sitting at 14 named storms this season. Pretty good, huh? With those cold waters in the Pacific, oceans try to balance out by warming up the tropical Atlantic waters to above average temperatures. So, if La Nina lingers around for another Summer, things could be active again.


With La Nina's anticipated return, records could fall again this winter. That would not be welcome news to most.


Tuesday, September 6, 2011

Tropical Patterns

Katia has reached major hurricane status in the Atlantic. After Irene lashed the Carolinas and skirted the Northeast, Katia has a lot of east-coasters holding their breath. As Katia formed, I had mentioned that the storm track appeared to take it out to sea and avoid being the second storm to hit the east coast in a month. So far, so good. Here are computer models for Katia's track.

All models have the storm re-curving out to sea. However, a common issue with tropical forecast is that a forecaster may wind up "riding" the models and forecasting what the computers spit out. When it comes to tropical forecasting, patterns almost work better than guidance.

Gut feelings often can be the best forecasting tool, assuming you have knowledge of the situation. Now, being from the Pacific Northwest, I obviously have little knowledge of topical histories. But having picked up a few hints along my studies have helped me to generate some opinions about the 2011 tropical season. My gut instinct was that Katia would curve out to sea. Here is why I stated that.

Take a look at Katia's actual track below.
Let's take a look at where Katia formed. Katia got tropical depression status at roughly 26 degrees West latitude and a day later was a tropical storm at roughly 33 degrees West latitude. So Katia formed rather quickly off the west coast of Africa. Through historical observations made, it has been determined that 90% of all tropical cyclones that develop EAST of 35 degrees West latitude will RE-CURVE off to sea. That is the exact situation we have with Katia. This was my first clue.

My second clue came through a process called teleconnectoins. Meteorologists use teleconnections in order to "anticipate" what may come down the road for a specific location but is used in the most general sense. The basics of this is this: what is occurring in the western Pacific (off coast of China/Japan) will occur on the U.S. east coast roughly 6-10 days later. Nothing is specific, it just assumes general trough/ridge patterns. Teleconnections can help forecast the track of a storm brewing in the Atlantic. When Katia formed, I took a look at what was occurring in the western Pacific. A trough was located just off the coast of Japan. So I inferred that this trough would generally move eastward and ultimately pull Katia out to sea when she wanders towards the U.S. coast!

I've been told it's better to go down on your own forecast than someone else's. So I decided to own my gut instinct and say what I thought; Katia will miss the U.S. and re-curve out to sea. I'm more than happy to live and die by my own forecast. That was a valuable advice given to me by one of my teachers whom I greatly respect.

Looking ahead, we have a new tropical disturbance developing in the east Pacific. Invest-95 has a high probability of becoming a tropical cyclone. Let's compare the track of Katia to that of Invest-95. 

Invest-95 has formed a little south of Katia's track, and is forecasted to track a bit north of Irene's path. Lots of time however for Invest-95 to change, so I'm not making a call on this yet.


Friday, July 15, 2011

No End In Sight

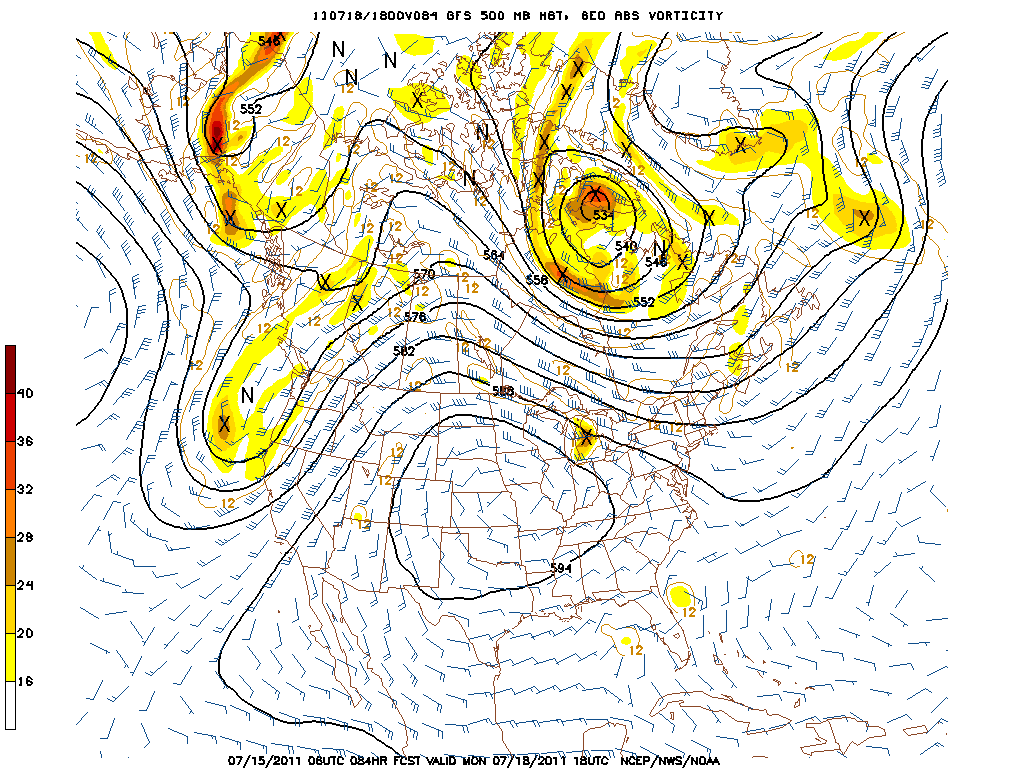
The Pacific Northwest continues to be mired in a Spring-like run of weather in the middle of Summer. Today marks the first day that average temperatures should reach 80 degrees, yet we are currently in a stretch of 8 consecutive days below 80 degrees. And then comes even worse news: there isn't an end on the horizon. Let's see why:


Above is our trusty 500mb chart. This is a set up known as the "Omega Block" because the graph resembles the Greek letter Omega. It is caused by a large ridge of high pressure over the Central U.S. and troughs on either side of the ridge. Under a ridge this big, hot air is sinking to the ground, resulting in scorching temperatures that have brought several days of triple digits. All we are stuck with is cool, gray conditions and some rain this week. That huge ridge blocks systems that typically track north into Canada but are now forced down into our backyard. This Omega Block has been set up for the better part of a week now and things aren't changing a whole lot.
This map is an anomaly chart that shows the average 500 mb lines from multiple model runs with different starting parameters. It basically gives us a an idea of where ridges and troughs will be 8-14 days in the future. Notice the big ridge over the Central U.S. has subsided a bit but the general trough in the NW/ridge in the East pattern still exists. That's not a welcoming sign for a return to Summer!
Here is a temperature probability map that correlates with the 500mb map 8-14 days out. I think this is pretty self-explanatory. Blues mean below average, red above. Yadda yadda yadda. Summer appears to be on hold until further notice. Maybe it's time to take a vacation...

Friday, June 17, 2011

Waiting For Arlene

Many of you may not know who Arlene is. That's ok, she was overshadowed by some of her more famous sisters. She last showed up in June of 2005. She came to the Southern U.S. from Honduras and killed a person. She was the first of her kind that year, many others followed and did far worse things.

Of course I am talking about Tropical Storm Arlene. She made landfall about 6 years ago to the date. For a tropical storm, she was a large one. Just missing hurricane status. But she ushered in one of the most active and historic hurricane seasons on record! Her more famous sisters are known as Hurricane Katrina and Hurricane Rita. There were 26 named storms in 2005, so many that we ran out of names and had to use names from the Greek alphabet for the remaining storms.

2011 tropical season is underway, it began June 1st. So far, the Atlantic basin has been quiet. But forecasters have warned that it will not remain that way as the season progresses. The Climate Prediction Center says the Atlantic will see 12-18 named storms, 6-10 of which may reach hurricane status (sustained winds over 1 minuet that measure at least 74 m.p.h). Of the named storms, the CPD says that 3 to 6 of them may become major hurricanes (Cat. 3 or higher, winds at least 111 m.p.h.). This would equate to what is referred to as a "hyper-active" hurricane season. 2005 definitely qualifies as a hyper-active season, and we just endured one last year. 2010 was an active, yet rare year. 19 named storms in the Atlantic and NOT ONE of those storms made landfall in the U.S. This is very rare.

Your probably asking yourself, "How can they forecast an entire hurricane season when they can't even predict the weather 36 hours out?!". There are signs but before I talk about those that are scientific, I want to just brush over a little research I did.

The U.S. has had a wild Spring. A record amount of tornadoes and severe weather in general across much of the country has us praying for that Summer weather to give us a break. I decided to look at past Springs and the amount of severe weather and compare it to the following Hurricane Season.

Last year, we had 1,543 reported tornadoes. As I mentioned above, 2010 had 19 named storms but none made landfall. 2009 had 1,305 tornadoes and nine named storms (1 landfall). 1,685 tornadoes were reported in 2008 and we had 16 named tropical storms that Summer (3 landfalls). 1,102 tornadoes and 15 named storms (1 landfall) in 2007. 1,117 tornadoes and nine named storms for 2006. Our active hurricane season in 2005 (26 named, five landfalls!) only had 1,262 tornado reports. Finally, 1,820 tornadoes were reported in 2004 with 15 named storms (three landfalls). Breaking down the stats, it is somewhat difficult to draw correlations between active Springs and Summers. So far this year, there have been 1,482 preliminary tornado reports. Those haven't been all confirmed yet. But still a high number. What will that translate into for this Summer?

Let's talk about trends that DO correlate to an active tropical season. We will begin with sea water temperatures. Warm water is "fuel" to a hurricane so the warmer the water, the better a chance to get storms to fire up and strengthen. The Atlantic waters are impacted by what happens off of our coast here in the Pacific. Our cool Spring can be credited to the cool, La Nina conditions. The La Nina typically gives us cooler than normal ocean waters here in the Pacific. The main goal of the ocean is to balance itself out. If we have a cold Pacific, the oceans will make up for it by having a warm Atlantic. Warm waters in the Atlantic means a good amount of "fuel" for storms this Summer!

Warm surface waters mean provide the atmosphere with a lot of uplift. When the sun strikes the warm waters and warms the air around it, that air will begin to lift. And guess what lift means for storms? You got it! Rising motions in the atmosphere help aid hurricanes and all storms for that matter! Now we have warm waters in the Atlantic and that means plenty of uplift for our storms.

Here is a map of 2010 and the storm tracks of those 19 storms that Summer.
Note how many made their way into the Gulf of Mexico. As only one storm tracked into the Gulf, that could mean a lot of untapped energy will remain for this hurricane season. As a tropical storm or hurricane makes its way through the warm Gulf, it feeds off the warm waters. When that warm surface waters get used up, the ocean pulls up cooler water from below to replace that warm water. The more storms that track through the Gulf, the less fuel for the next storms to use. With only one storm moving through that area last year, that could mean plenty of leftover energy just waiting to be used this year!

So there are the "proven", scientific reasons as to why we could see a very active, fun but dangerous 2011 Atlantic Hurricane Season.